Reporting & key figures
Hours, absences, expenses and headcount analysed, drillable down to the individual person and exportable as Excel, PDF or PowerPoint.
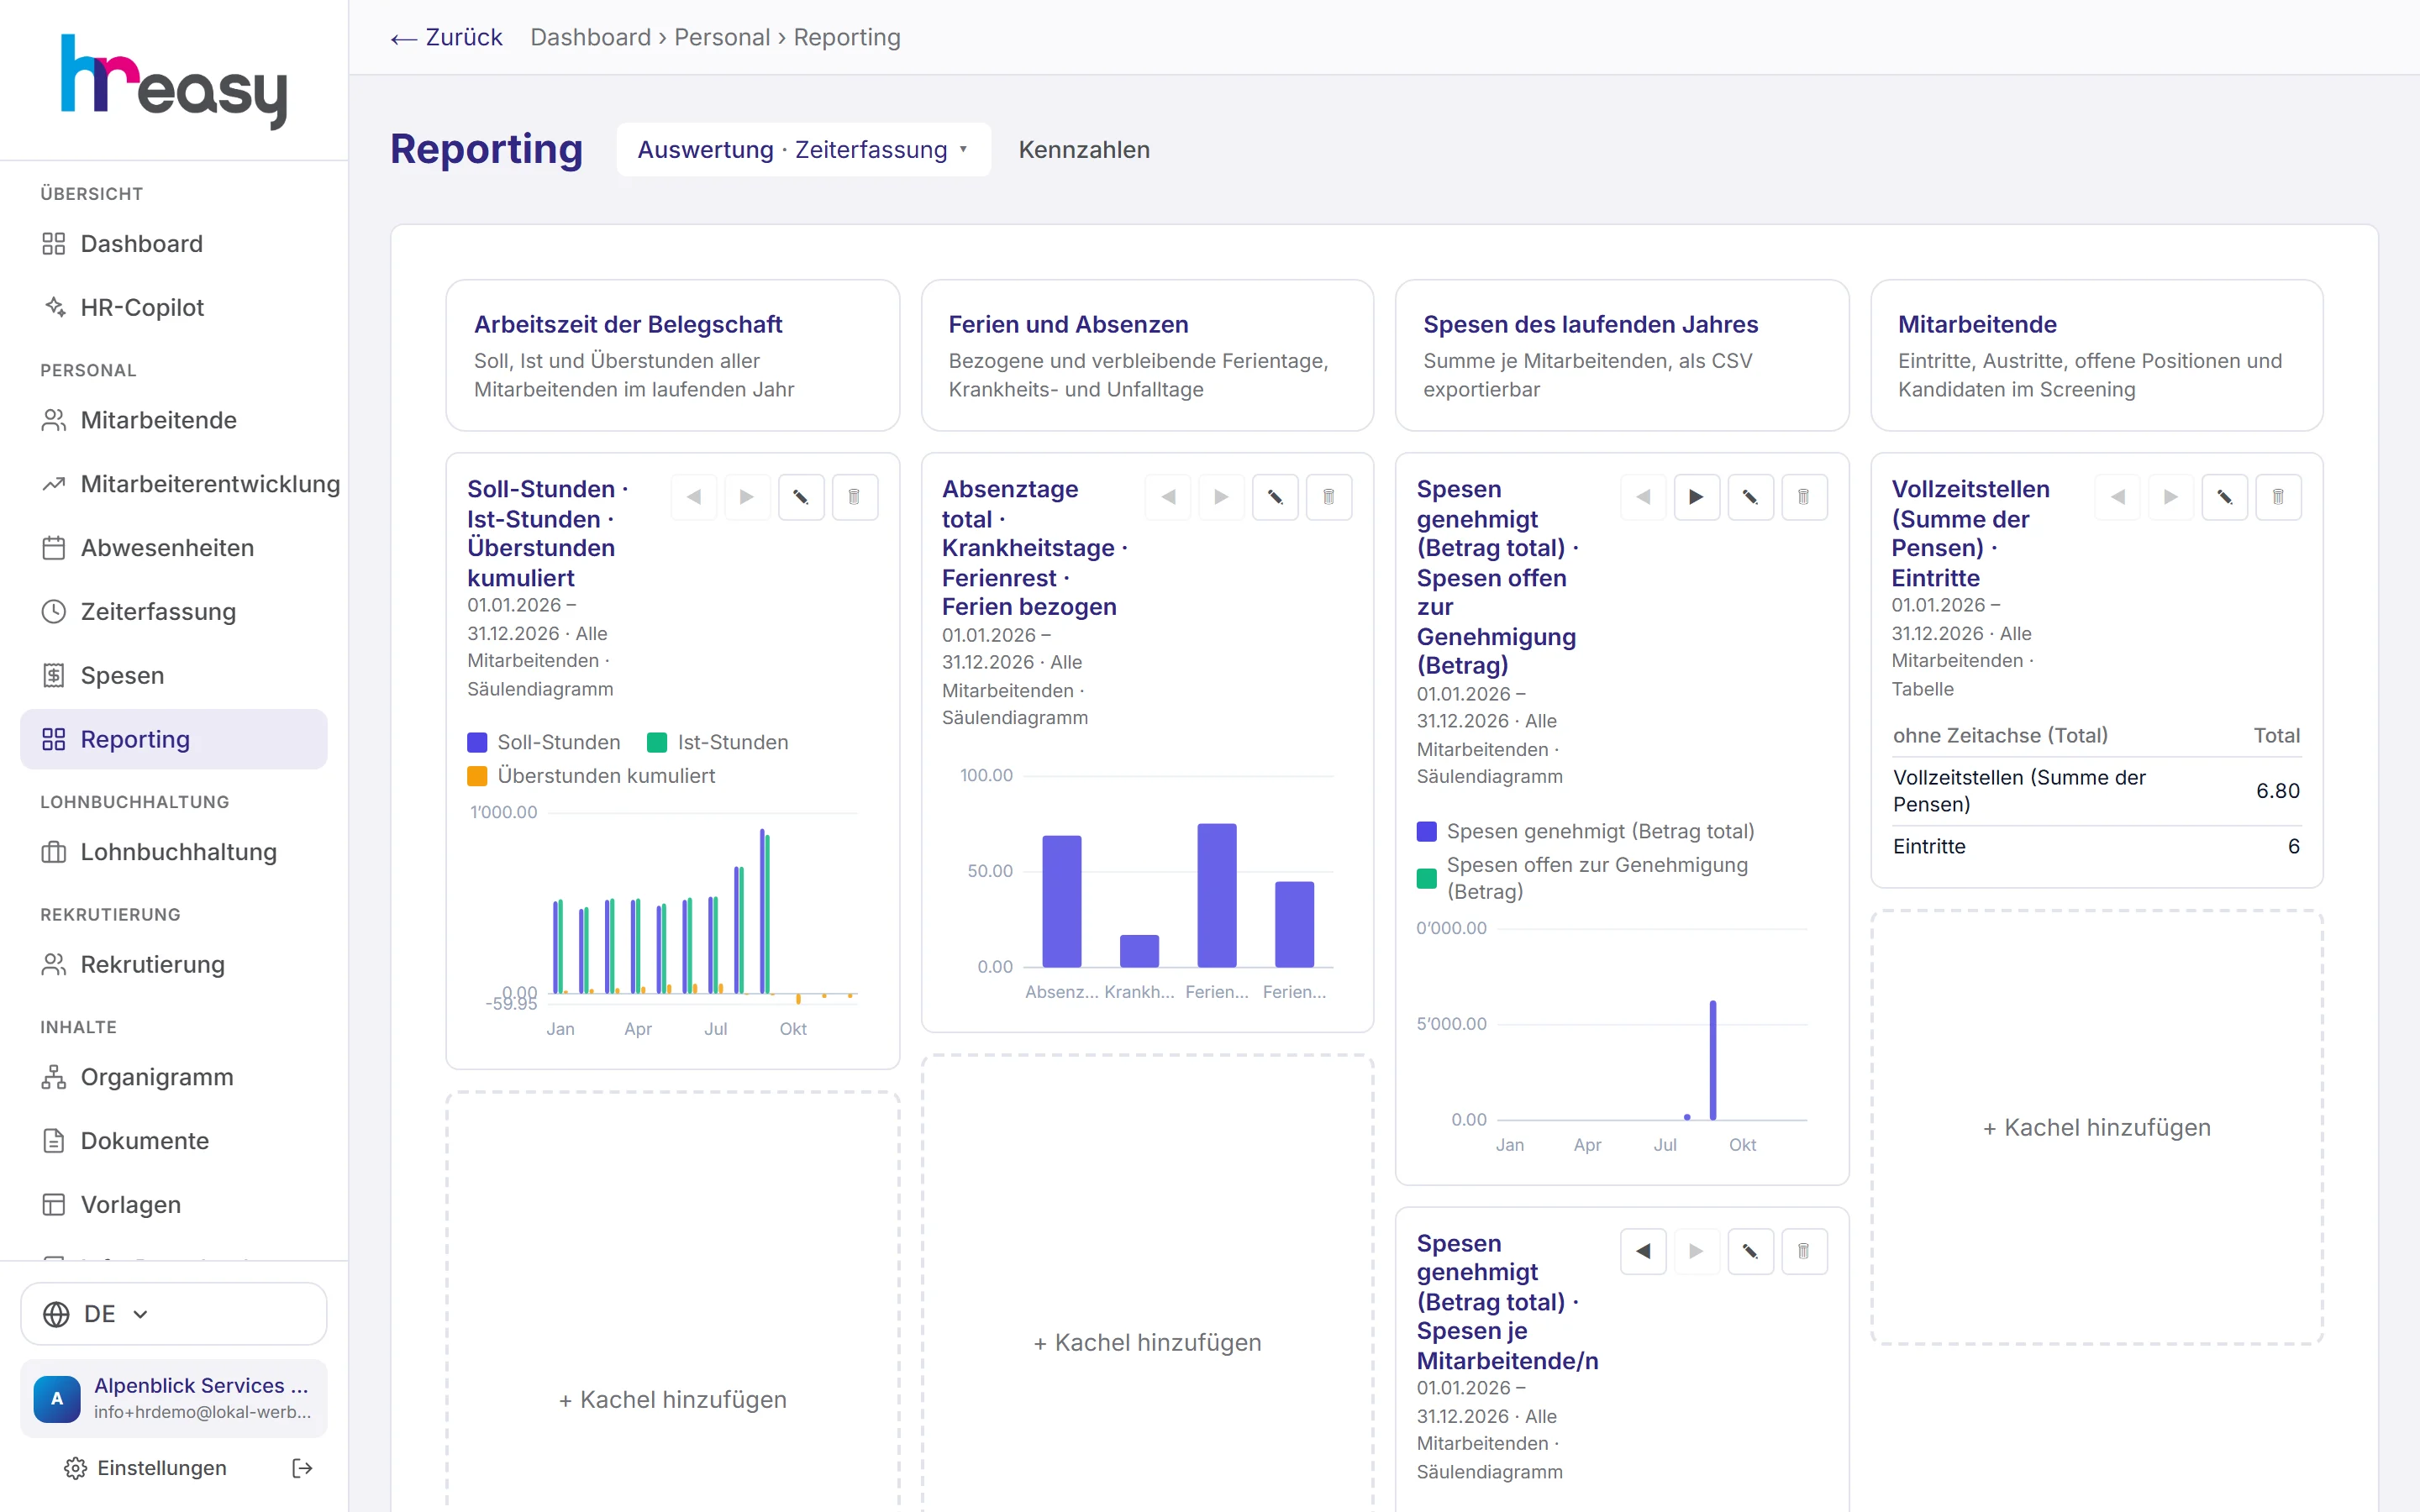
How much overtime has the company built up this year? Which location has the highest absence rate? In many SMEs questions like these land with someone who merges three exports in Excel, and the answer is out of date before it is in the email.
In HREasy reporting, the figures are already there, because they come from time tracking, absences, expenses and the personnel file, which are kept in the system anyway. You choose topic, period and unit, drill a figure down to the individual day and export the result. The calculation always happens in the system itself, never in the language model.
Sound familiar?
- For every analysis you combine exports from different programs in Excel.
- A figure in the report can no longer be explained because nobody knows what it is made of.
- Management wants to compare locations, but the data is not available by location.
- Anomalies such as rising absences only show up in the annual review.
Four topics, drilled down as far as you like
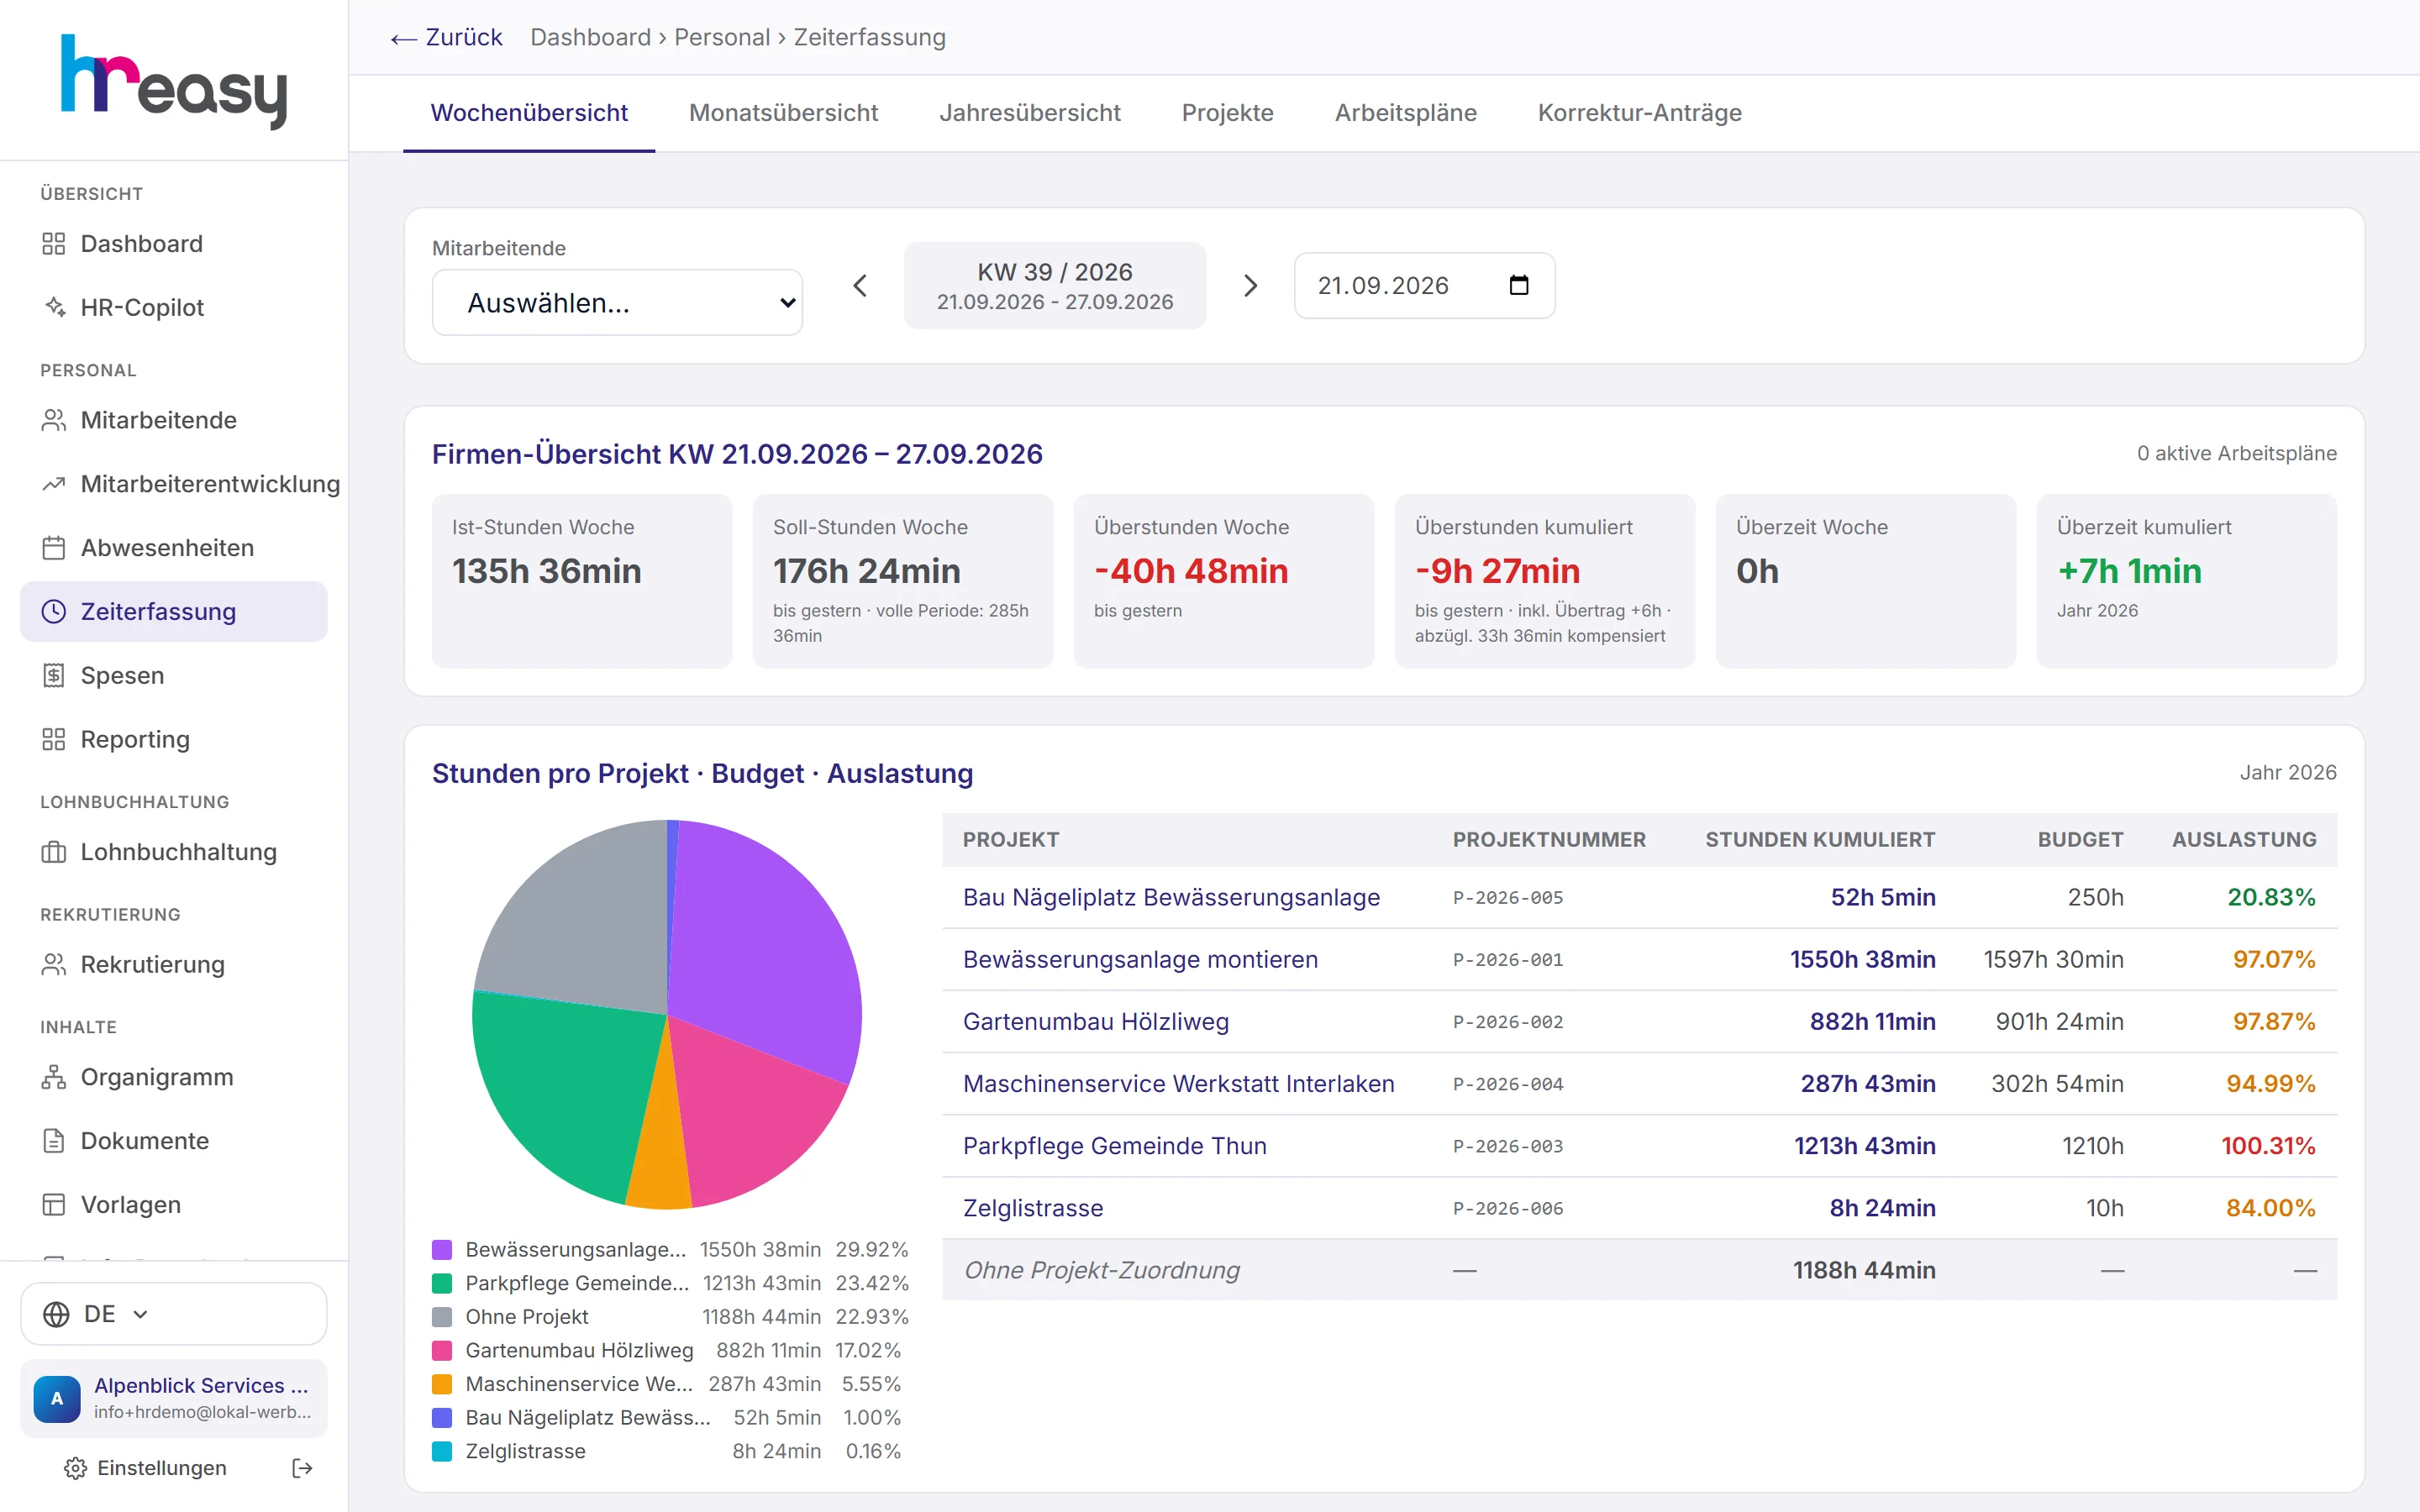
The analysis covers time tracking, absences, expenses and employees. You choose a person, everyone or an organisational unit, plus period and comparison period. The annual trend appears as a chart, and the «Pro Monat» (per month) table can be expanded down to week and day.
Under «Meine Auswertungen» (my analyses) you build your own tiles. An assistant guides you through the fields and shows a preview straight away; tiles are saved per user.
- Location drill-down: location, people, months, weeks, days in a tree table
- «Days per absence type» table for each person
- Nine chart types, including waterfall, histogram and radar
- Master data as a table: sensitive fields such as salary or AHV number are never preselected
Every figure with origin, trend and comparison
The key figures view shows headcount, FTE, staff turnover, absence rate, overtime, payroll costs per head, time-to-hire and other values over several years. Each tile knows whether more is good or bad and colours its trend accordingly.
A click on «Woraus besteht diese Zahl?» (what makes up this figure?) breaks it down by location, department, team or cost centre and leads all the way to the individual person and their file.
- Cross table, for example unit by absence type
- «Einheiten vergleichen» (compare units): two units side by side with the difference
- «Was sich verändert hat» (what has changed) and an expectation for the next period
- Saved views that can be shared with the team
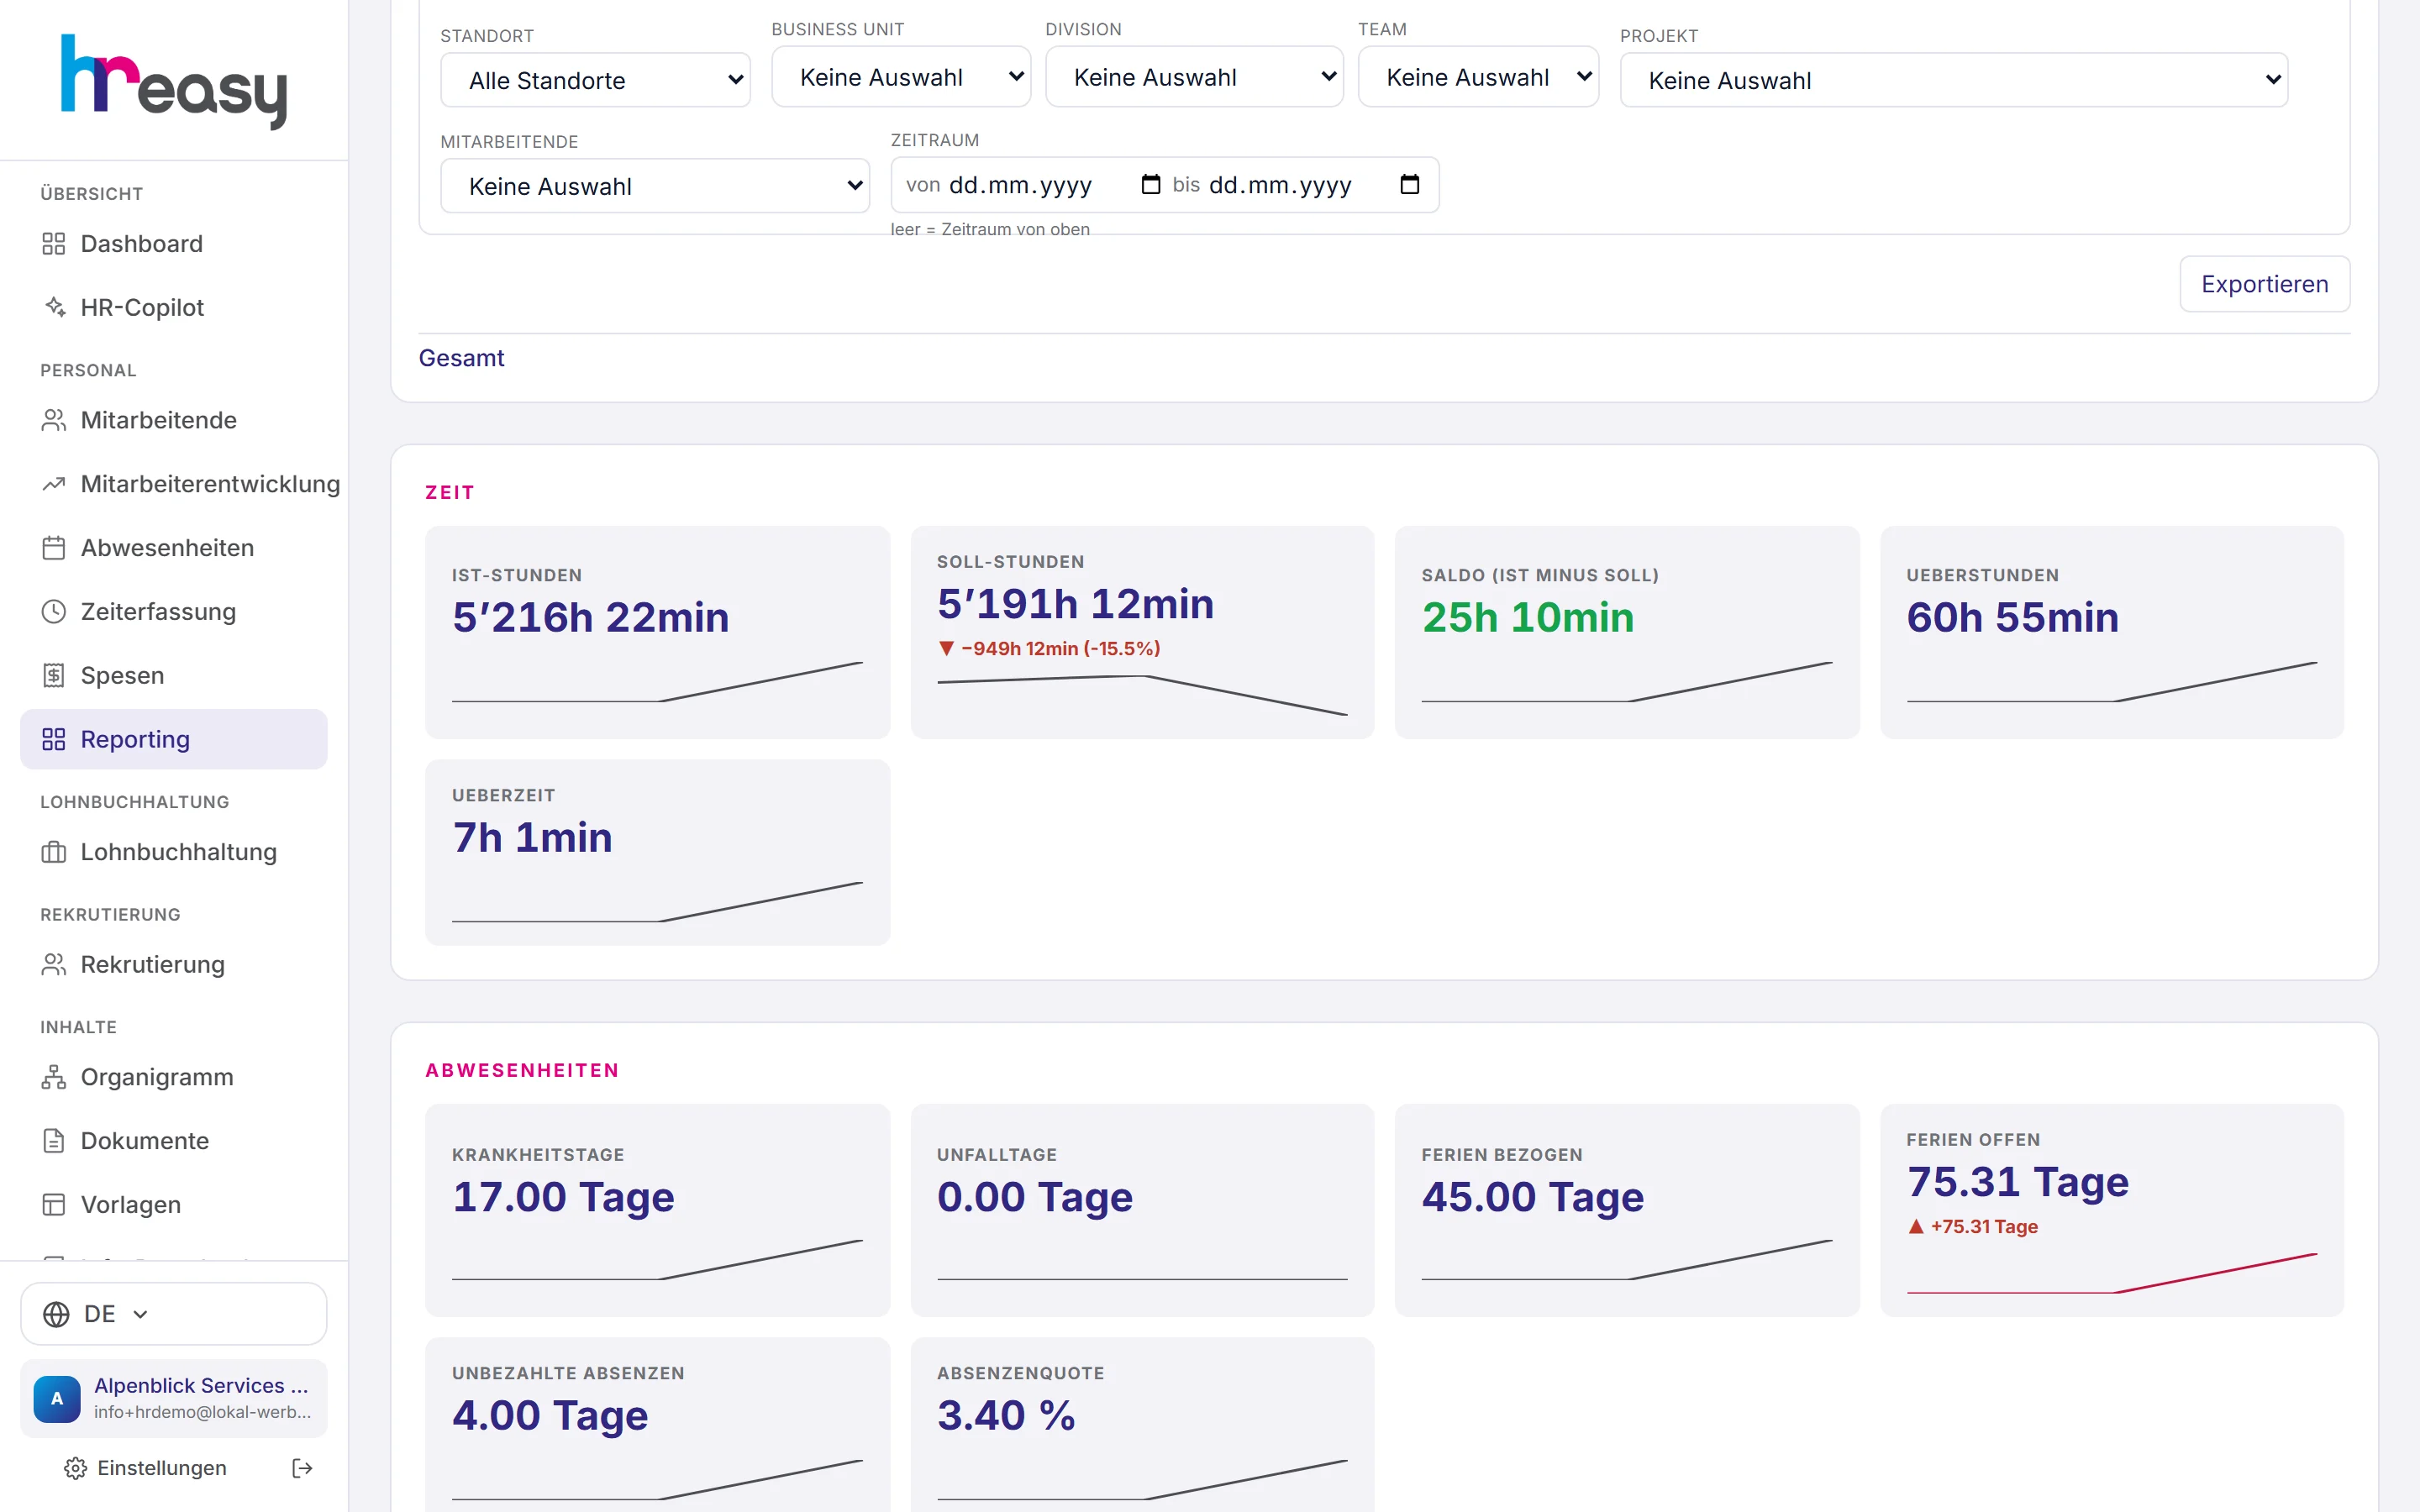
Spot when a unit is out of line
For each unit you can store target values with a warning threshold; the traffic light shows where a target is missed. A daily run also reports units that differ markedly from the median of the others, and the alerts can be ticked off.
The «Compliance» section checks working and rest times, minimum wages and pay equality between women and men by unit, using the same rules as in the payroll run.
- Early warning every morning, statistically based on median and spread
- Pay equality: median for women versus men per unit
- Roles with location restrictions only see their own part here too
From recording to the finished report
The figures are created where the work is done. Reporting only has to bring them together.
Record
Hours, absences, expenses and master data are recorded day to day in their modules.
Combine
Reporting reads all sources with the same rules, such as the daily minutes of time tracking.
Drill down
Every figure can be expanded to location, team, person and day.
Interpret
If you wish, the AI analyses the prepared data; every figure it mentions is cross-checked.
Share
Export as Excel, PDF or PowerPoint, or as CSV straight by email, for example to your fiduciary.
Everything works together
No module stands alone. What you enter here flows automatically to wherever it is needed, without entering it twice.
What HREasy offers
Key figure catalogue
Time, absence, costs, development, recruiting and headcount, each key figure with its direction: whether more is good or bad.
Multi-year comparison
Key figures over several years side by side. HREasy only speaks of a trend from three years onwards.
Drill-down to the person
«Woraus besteht diese Zahl?» (what makes up this figure?) leads via location, department and team to the person and into their file.
Your own tiles
Under «Meine Auswertungen» (my analyses) you build tiles with an assistant, with live preview and an AI shortcut if you like.
Targets and traffic lights
Targets per unit with a warning threshold; the traffic light shows immediately where things are stuck.
Early warning
A daily run reports units with a noticeable deviation or a missed target.
Compliance check
Working and rest times, minimum wages and pay equality by unit, using the same rules as in the payroll run.
AI with figure check
Active analysis, free question and AI chart. The AI only receives the prepared dataset, and every figure in its answer is checked against the data.
Export and sending
Excel, PDF and PowerPoint with section selection, CSV by email to predefined recipients.
What you should know
The AI does not calculate, it interprets
Language models are good at wording and poor at arithmetic. That is why HREasy calculates all figures in the system and only gives the AI the finished dataset to interpret.
If the answer still mentions a figure that does not appear in the data, it is flagged or discarded. What you read is backed up.
A trend needs three years
A year with many sick days can be chance, a flu wave for example. HREasy shows changes compared with the previous year but only speaks of a trend from three years onwards.
Early warning is equally cautious: it compares a unit with the median of the others and only reports clear deviations.
Frequently asked questions
Where do the figures come from?
From the modules in which work is done anyway: time tracking, absences, expenses, personnel file, recruiting and employee development. There is no separate import.
Can I compare locations or teams?
Yes. Every key figure can be broken down by location, department, team or cost centre, and «Einheiten vergleichen» (compare units) puts two units side by side with the difference.
Which exports are available?
Key figures as Excel, PDF or PowerPoint with section selection, analyses as PowerPoint, plus CSV by email, for example to your fiduciary.
Do all users see all figures?
No. Roles restricted to a location or unit only see their own part everywhere, including alerts and targets. The server decides which master data fields a role can see.
Do employees have access to reporting?
No, reporting is reserved for administration. Employees only see their own balances in the portal.
More modules
Ready to automate reporting?
Set up in 5 minutes, no HR knowledge needed. The agent takes care of the rest.
Request trial access now